- Slug: BC-Border Poll, 1,700 words
- Photos below
- Video on YouTube
- with BC-Border Crossing; BC-Border Jobs; BC-Border Methodology
- Poll results Graphics embed codes below.
SUBHEAD: New poll by Cronkite News, Univision News and The Dallas Morning News shows strong sense of community on both sides of the U.S.-Mexico border.
By Molly Bilker
Cronkite News
Despite heated political rhetoric about the U.S.-Mexico border, people who live in the region largely view themselves as one community, believe in making it easier to cross back and forth and do not favor building a new wall, according to a Cronkite News-Univision News-Dallas Morning News poll.
The poll is the first of its kind in more than 15 years and reflects the attitudes of nearly 1,500 respondents in 14 U.S. and Mexican cities from California to Texas.
A majority — 69 percent on the Mexico side and 59 percent on the U.S. side — believe the current presidential campaign is hurting the region, an area that’s one of the most culturally vibrant parts of both countries. Poll respondent Ivonne Gonzalez, 56, of Nogales, Arizona, echoed voices of residents who want more bridges, not walls, declaring:
“I’m not in favor of building another wall,” said Gonzalez. “But our opinions as residents are not taken into consideration.”
The poll, with a margin of error of plus or minus 3.7 percentage points, was conducted in May by Austin-based Baselice & Associates, Inc. It included questions on quality of life and cross-border relations, and was conducted in person and over the phone in both English and Spanish. Baselice did the last poll in 2001, before the 9/11 terrorist attacks.
The border poll was funded by the media partners and the public, through the crowdfunding platform Beacon, which matched the contributions.
A team of Cronkite News reporters and photojournalists traveled to several cities along the 2,000-mile border to get reaction to the poll findings and hear the views of border residents, community leaders and poll respondents.
Among the poll’s findings:
- Seventy-two percent of respondents on U.S. side and 86 percent of those interviewed on Mexican side said they are opposed to building a wall.
- Seventy-six percent of Mexicans said they don’t trust their law enforcement officials while 82 percent of those polled on the U.S. side said they do trust their authorities.
- Fifty-one percent of those polled on the Mexican side and 54 percent on the U.S. side said they oppose the legalization of marijuana.
Residents on both sides describe a sense of community and dependency with their sister cities across the border, with 79 percent of those polled in Mexico and 86 percent in the United States saying they like their neighbors.
“The economy of Nogales is based on Sonora and all of the people who spend their money in Arizona, whether Phoenix or Tucson,” said Carlos Rangel, who sells perfume in Nogales, Arizona. “We depend on one another for survival.”
For border residents campaign rhetoric misses real issues
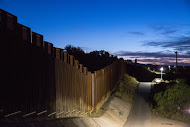
Chants of “build the wall” have been heard at rallies for Republican presumptive nominee Donald J. Trump, who has made building a wall along the border a cornerstone of his campaign.
On the border, it’s a different story. San Diego resident Daisy Garcia, 32, said the national portrayal of the border does not reflect the daily reality for most people who call the region home.
“I think when people think about the border … it’s probably all the violence and insecurity,” Garcia said. “I think there’s a negative connotation to ‘the border,’ when in reality, I don’t think it’s that bad,” explaining the area is among the safest in the country.
Poll results showed significant opposition to building a wall, with 77 percent of Mexican respondents and 70 percent of U.S. respondents saying a wall is not important in comparison to other issues.
“I think it’s just ridiculous,” said Elizabeth MacTavish, 29, a mother of two young children in Del Rio, Texas. “Down at the border, I think there are more problems on the planet and within our own country than a freaking fence.”
Many border residents said a new wall would not deter those who want to cross the border illegally or drug smuggling.
“I don’t care what you put up; somebody’s going to find a way to get over it,” said Irene Riley, 70, a border resident living in Columbus, New Mexico.
In Mexico, resident Roberto Montijo, 26, a student at the University of Sonora in Nogales, Sonora, is among those who spoke out against a building a new border wall.
“I think it’s completely illogical,” Montijo said. “It’s an irrational and racist position.”
The majority of Mexican respondents (62 percent) and nearly half the U.S. respondents (47 percent) said they felt the federal government does not understand the needs of the border region, such as cutting bridge wait times or generating well-paying jobs to help with a brain drain.
“Our government does not understand border problems,” said Armando Quintana, 70, a retired banking employee who lives in Tijuana. “Our government is concentrated in the center of the republic and does not understand the northern region of the country,” he said, explaining that nationalistic views in Mexico City fail to understand how dependent border communities are to one another.
Easier mobility across the border
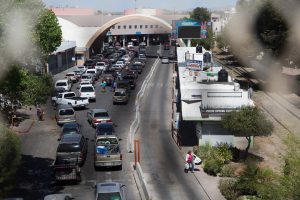
Poll results indicated that border residents — 88 percent in Mexico and 77 percent in the U.S. — favor easier mobility across the border by shortening wait times at the border crossing and by easing requirements for people on either side to cross.
A path to citizenship for unauthorized immigrants who live in the United States has huge support, according to the poll, with 90 percent of Mexican respondents and 82 percent of U.S. respondents in favor.
“There are a lot of people trying to make a living — as Mexicans call it, the American dream,” said Ray Perez, 46, who lives in El Paso. He was visiting Ciudad Juarez to buy medicine for his grandson. “I think they should make it easier.”
Poll respondent Rangel, a retiree in Nogales, Arizona, who sells perfume from home, feels the presidential race has no real impact on border life.
“Whether Hillary Clinton or Mr. Trump wins, Nogales will be the same or worse,” said Rangel, explaining that the border remains isolated, misunderstood and only a topic of debate during campaigns.
Crime, insecurity major concerns in Mexican cities
In Mexico, 68 percent of respondents placed crime and security concerns in their top three most important issues — up 25 percentage points from 2001. Additionally, 76 percent of Mexican poll respondents said they don’t trust law enforcement officers in their country — in contrast with the 82 percent of U.S. border residents who said they do trust law enforcement in their country.
“Honestly, if I’m driving at night or during the day and I see a police officer, I feel scared rather than safe here in Ciudad Juarez,” said Tomás Domínguez, a resident of the Mexican border city.
Border regions in Mexico that have experienced drug-related violence have also had to cope with increased police corruption. Though violence has declined in several border cities in Mexico, residents remain concerned about another spike.
“I think it’s safer right now than it used to be a couple years ago,” said Cesar Martinez, 30, of Nuevo Laredo, Tamaulipas. “But I think that’s the most important issue, the violence generated by the drug cartels.”
Economy, jobs are top issue in U.S. cities
Forty-one percent of U.S. respondents said the economy and jobs are most important, while 40 percent of Mexican respondents did the same.
Economic difficulties, including employment, are a critical issue in Nogales, where residents on the Arizona side have seen shops close because of a fluctuating currency exchange rate and the weak Mexican peso.
“The economy of this town is based on Nogales, Sonora, Hermosillo, Ciudad Obregon, and on all of those who come and leave their money buying goods,” Rangel said. “If people don’t come, there’s no money.”
In Nogales, Arizona, 54 percent of residents say a lack of jobs that pay well has worsened during the past 15 years, when Baselice did the last border poll.
Nogales, Sonora, poll results show, has the highest percentage of respondents along the border who make less than $370 a month, at 66 percent.
Many Mexican border cities that depend heavily on visitors from the U.S. have also seen tourism die as violence spiked in Mexico. In Columbus, New Mexico – a town of only 1,760 people – lack of tourism because of fears of violence in the neighboring city of Palomas has hit the economy hard, said Mayor Philip Skinner, 69.
“Tourists have been slow to return to Palomas, have been slow to return to Mexico,” Skinner said. “So that impacts us.”
A sense of community along the border
Though they may have different priorities, border residents view the cities across the border as one community, according to the poll. Asked if they like their neighbors on the other side, the majority of respondents — 79 percent in Mexico and 86 percent in the U.S. — said yes.
Additionally, 69 percent of respondents in Mexico said their city depends either somewhat or very much on their sister city across the border. In the U.S., that number was even higher at 79 percent.
“Mexico is very important for Arizona. It is our largest trading partner by far,” said Sen. Jeff Flake, R-Ariz. “How can we grow economically if we shut our borders and build ‘fortress America’?”
A plurality of respondents — 45 percent in Mexico and 38 percent in the U.S. — called the people on the other side of the border “neighbors” rather than choosing other descriptions in the survey, including economic competitors, trading partners, criminals or racists.
“We really, in some sense, only have each other, and that has brought us incredibly close on every level, said Rep. Beto O’Rourke, D-El Paso. “And it’s something that I think is really beautiful and defining about who we are.”
Border residents often cross into their sister cities to go shopping, visit family and attend school or work. And most value their shared sense of community forged by history, business and blood ties.
Calai Hernandez, 35, who lives in Eagle Pass, Texas, across from Piedras Negras, Coahuila, visits Mexico regularly.
“They say Eagle Pass is a neighborhood of Piedras,” Hernandez said. “To me, going across the border is like going to a friend’s house.”


(Photo by Courtney Pedroza/Cronkite News)

Graphic embeds:
Title: Building a wall
Poll question: Should the U.S. build a wall between Mexico and the U.S. in an effort to secure the border…Is that definitely or maybe (should / should not)?
Type: Interactive – bar graph – toggle between countries
Highlights: Residents on both sides say overwhelmingly that they do not want to build a wall
Embed code: <script id=”infogram_0_5083ff4f-48ac-4c66-b373-fa51d832562d” title=”Build wall?” src=”//e.infogr.am/js/embed.js?XVA” type=”text/javascript”></script><div style=”padding:8px 0;font-family:Arial!important;font-size:13px!important;line-height:15px!important;text-align:center;border-top:1px solid #dadada;margin:0 30px”><a target=”_blank” href=”https://infogr.am/5083ff4f-48ac-4c66-b373-fa51d832562d” style=”color:#989898!important;text-decoration:none!important;”>Build wall?</a><br><a style=”color:#989898!important;text-decoration:none!important;” href=”http://charts.infogr.am/bar-chart?utm_source=embed_bottom&utm_medium=seo&utm_campaign=bar_chart” target=”_blank”>Create bar charts</a></div>
Title: Importance of wall issue in border communities
Poll question: Which of the following best describes how important it is to build a wall along the border as compared to other issues?
Type: Interactive – bar graph – toggle between countries
Highlights: Residents on both sides say it is not very important or not important at all
Embed: <script id=”infogram_0_dbc4afd3-e579-4d3d-84ab-dc4a1930831d” title=”Importance of wall” src=”//e.infogr.am/js/embed.js?OxG” type=”text/javascript”></script><div style=”padding:8px 0;font-family:Arial!important;font-size:13px!important;line-height:15px!important;text-align:center;border-top:1px solid #dadada;margin:0 30px”><a target=”_blank” href=”https://infogr.am/dbc4afd3-e579-4d3d-84ab-dc4a1930831d” style=”color:#989898!important;text-decoration:none!important;”>Importance of wall</a><br><a style=”color:#989898!important;text-decoration:none!important;” href=”http://charts.infogr.am/bar-chart?utm_source=embed_bottom&utm_medium=seo&utm_campaign=bar_chart” target=”_blank”>Create bar charts</a></div>
Title: Most important issues – Mexico border cities
Poll question: In order of importance, please describe in your own words the three most important issues or problems facing you and your family.
Type: Stacked bar graph
Highlights: economy and crime/drugs are top issues
Embed: <script id=”infogram_0_2af6e7e6-607f-4da0-a91b-64bbee17f0bf” title=”Most important issues (Mexico)” src=”//e.infogr.am/js/embed.js?Vqe” type=”text/javascript”></script><div style=”padding:8px 0;font-family:Arial!important;font-size:13px!important;line-height:15px!important;text-align:center;border-top:1px solid #dadada;margin:0 30px”><a target=”_blank” href=”https://infogr.am/2af6e7e6-607f-4da0-a91b-64bbee17f0bf” style=”color:#989898!important;text-decoration:none!important;”>Most important issues (Mexico)</a><br><a style=”color:#989898!important;text-decoration:none!important;” href=”http://charts.infogr.am/column-chart?utm_source=embed_bottom&utm_medium=seo&utm_campaign=column_chart” target=”_blank”>Create column charts</a></div>
Title: Most important issues – U.S. border cities
Poll question: In order of importance, please describe in your own words the three most important issues or problems facing you and your family.
Type: Stacked bar graph
Highlights: Economy, crime/drugs and education are top issues
Embed: <script id=”infogram_0_c1f20974-db41-4118-a6a3-250d551cd40c” title=”Most important issues (US)” src=”//e.infogr.am/js/embed.js?1dh” type=”text/javascript”></script><div style=”padding:8px 0;font-family:Arial!important;font-size:13px!important;line-height:15px!important;text-align:center;border-top:1px solid #dadada;margin:0 30px”><a target=”_blank” href=”https://infogr.am/c1f20974-db41-4118-a6a3-250d551cd40c” style=”color:#989898!important;text-decoration:none!important;”>Most important issues (US)</a><br><a style=”color:#989898!important;text-decoration:none!important;” href=”http://charts.infogr.am/column-chart?utm_source=embed_bottom&utm_medium=seo&utm_campaign=column_chart” target=”_blank”>Create column charts</a></div>
Title: Sister city relationships
Poll question: When you think about (Americans / Mexicans) on the other side of the border, do you view them mainly as…?
Type: Interactive – doughnut – toggle between countries
Highlights: Residents on both sides see other side as “neighbors”
Embed: <script id=”infogram_0_ddc3d994-1d85-4e3c-b23f-7a97d6ae475d” title=”Neighbors” src=”//e.infogr.am/js/embed.js?YpQ” type=”text/javascript”></script><div style=”padding:8px 0;font-family:Arial!important;font-size:13px!important;line-height:15px!important;text-align:center;border-top:1px solid #dadada;margin:0 30px”><a target=”_blank” href=”https://infogr.am/ddc3d994-1d85-4e3c-b23f-7a97d6ae475d” style=”color:#989898!important;text-decoration:none!important;”>Neighbors</a><br><a style=”color:#989898!important;text-decoration:none!important;” href=”http://charts.infogr.am/pie-chart?utm_source=embed_bottom&utm_medium=seo&utm_campaign=pie_chart” target=”_blank”>Create pie charts</a></div>
Title: Dependence on sister cities
Poll question: Which of the following best describes how much you depend on your sister city across the border?
Type: Interactive – bar graph – toggle between countries
Highlights: Residents on both sides say they depend “very much” or “somewhat”
Embed: <script id=”infogram_0_1c70fdf5-414f-4757-9709-857f397fae67″ title=”Depends on Sister City” src=”//e.infogr.am/js/embed.js?dXj” type=”text/javascript”></script><div style=”padding:8px 0;font-family:Arial!important;font-size:13px!important;line-height:15px!important;text-align:center;border-top:1px solid #dadada;margin:0 30px”><a target=”_blank” href=”https://infogr.am/1c70fdf5-414f-4757-9709-857f397fae67″ style=”color:#989898!important;text-decoration:none!important;”>Depends on Sister City</a><br><a style=”color:#989898!important;text-decoration:none!important;” href=”http://charts.infogr.am/column-chart?utm_source=embed_bottom&utm_medium=seo&utm_campaign=column_chart” target=”_blank”>Create column charts</a></div>
Title: Good jobs: Then and now
Poll question: How do good paying jobs compare to five years ago?
Type: Interactive – bar graph – toggle between countries
Highlights: Residents on both sides say jobs are strongly or somewhat worse
Embed: <script id=”infogram_0_5c49b221-4191-40f6-9a4b-f297f45137dd” title=”Good jobs” src=”//e.infogr.am/js/embed.js?Xz2″ type=”text/javascript”></script><div style=”padding:8px 0;font-family:Arial!important;font-size:13px!important;line-height:15px!important;text-align:center;border-top:1px solid #dadada;margin:0 30px”><a target=”_blank” href=”https://infogr.am/5c49b221-4191-40f6-9a4b-f297f45137dd” style=”color:#989898!important;text-decoration:none!important;”>Good jobs</a><br><a style=”color:#989898!important;text-decoration:none!important;” href=”http://charts.infogr.am/bar-chart?utm_source=embed_bottom&utm_medium=seo&utm_campaign=bar_chart” target=”_blank”>Create bar charts</a></div>
Title: Drug trafficking
Poll question: Do you think progress is being made against drug trafficking?
Type: Interactive – pie chart – toggle between countries
Highlights: U.S. border cities say yes, Mexico border cities say no
Embed: <script id=”infogram_0_b8776358-ebd7-439a-993d-46a1ec61facf” title=”Poll: Drug Trafficking” src=”//e.infogr.am/js/embed.js?Wjw” type=”text/javascript”></script><div style=”padding:8px 0;font-family:Arial!important;font-size:13px!important;line-height:15px!important;text-align:center;border-top:1px solid #dadada;margin:0 30px”><a target=”_blank” href=”https://infogr.am/b8776358-ebd7-439a-993d-46a1ec61facf” style=”color:#989898!important;text-decoration:none!important;”>Poll: Drug Trafficking</a><br><a style=”color:#989898!important;text-decoration:none!important;” href=”http://charts.infogr.am/pie-chart?utm_source=embed_bottom&utm_medium=seo&utm_campaign=pie_chart” target=”_blank”>Create pie charts</a></div>
Title: Trust in law enforcement
Poll question: Do you trust law enforcement officers in your country?
Type: Interactive – pie chart – toggle between countries
Highlights: U.S. residents say yes, Mexico residents say no
Embed: <script id=”infogram_0_bbcf3c65-81be-42ea-a818-fbd6134aec2b” title=”Poll: Trust in Law Enforcement” src=”//e.infogr.am/js/embed.js?Z87″ type=”text/javascript”></script><div style=”padding:8px 0;font-family:Arial!important;font-size:13px!important;line-height:15px!important;text-align:center;border-top:1px solid #dadada;margin:0 30px”><a target=”_blank” href=”https://infogr.am/bbcf3c65-81be-42ea-a818-fbd6134aec2b” style=”color:#989898!important;text-decoration:none!important;”>Poll: Trust in Law Enforcement</a><br><a style=”color:#989898!important;text-decoration:none!important;” href=”http://charts.infogr.am/pie-chart?utm_source=embed_bottom&utm_medium=seo&utm_campaign=pie_chart” target=”_blank”>Create pie charts</a></div>
Title: Perceptions of safety
Poll question: Which of the following describes how safe you feel in your neighborhood at night?
Type: Interactive – pie chart – toggle between countries
Highlights: U.S. residents say “extremely safe” or “very safe,” Mexico residents say say “not that safe” or “not that safe at all”
Embed: <script id=”infogram_0_2b670a47-3302-4468-a655-bcb4a9264e04″ title=”Poll: Feeling Safe” src=”//e.infogr.am/js/embed.js?qqx” type=”text/javascript”></script><div style=”padding:8px 0;font-family:Arial!important;font-size:13px!important;line-height:15px!important;text-align:center;border-top:1px solid #dadada;margin:0 30px”><a target=”_blank” href=”https://infogr.am/2b670a47-3302-4468-a655-bcb4a9264e04″ style=”color:#989898!important;text-decoration:none!important;”>Poll: Feeling Safe</a><br><a style=”color:#989898!important;text-decoration:none!important;” href=”http://charts.infogr.am/pie-chart?utm_source=embed_bottom&utm_medium=seo&utm_campaign=pie_chart” target=”_blank”>Create pie charts</a></div>
Title: Border Patrol
Poll question: Do you believe there is a need for more Border Patrol agents on your side of the border?
Type: Bar graph
Highlights: Majorities on both sides say no, but Mexico residents are more strongly opposed
Embed code: <script id=”infogram_0_401bc65a-a47e-4f6d-a9e7-663cbd95c134″ title=”more border patrol?” src=”//e.infogr.am/js/embed.js?buv” type=”text/javascript”></script><div style=”padding:8px 0;font-family:Arial!important;font-size:13px!important;line-height:15px!important;text-align:center;border-top:1px solid #dadada;margin:0 30px”><a target=”_blank” href=”https://infogr.am/401bc65a-a47e-4f6d-a9e7-663cbd95c134″ style=”color:#989898!important;text-decoration:none!important;”>more border patrol?</a><br><a style=”color:#989898!important;text-decoration:none!important;” href=”http://charts.infogr.am/bar-chart?utm_source=embed_bottom&utm_medium=seo&utm_campaign=bar_chart” target=”_blank”>Create bar charts</a></div>
Title: How conditions on the border have changed (U.S. border cities)
Poll question: Compared to five years ago, please tell me if each issue listed is something that is getting better, getting worse or staying about the same…Is that strongly or somewhat (better / worse)?
Type: Stacked bar graph
Highlights: Good paying jobs and time to cross border are getting worse or staying the same while education access is getting better or staying the same
Embed: <script id=”infogram_0_a96bed96-3341-4d51-a772-f682d30096ec” title=”US issues better/worse” src=”//e.infogr.am/js/embed.js?jEd” type=”text/javascript”></script><div style=”padding:8px 0;font-family:Arial!important;font-size:13px!important;line-height:15px!important;text-align:center;border-top:1px solid #dadada;margin:0 30px”><a target=”_blank” href=”https://infogr.am/a96bed96-3341-4d51-a772-f682d30096ec” style=”color:#989898!important;text-decoration:none!important;”>US issues better/worse</a><br><a style=”color:#989898!important;text-decoration:none!important;” href=”http://charts.infogr.am/bar-chart?utm_source=embed_bottom&utm_medium=seo&utm_campaign=bar_chart” target=”_blank”>Create bar charts</a></div>
Title: How conditions on the border have changed (Mexico border cities)
Poll question: Compared to five years ago, please tell me if each issue listed is something that is getting better, getting worse or staying about the same…Is that strongly or somewhat (better / worse)?
Type: Stacked bar graph
Highlights: Mexico residents say good paying jobs and wildlife are worse or unchanged
Embed: <script id=”infogram_0_807a9f5d-1a41-4458-8435-303000423383″ title=”Mexico issues better/worse” src=”//e.infogr.am/js/embed.js?5DA” type=”text/javascript”></script><div style=”padding:8px 0;font-family:Arial!important;font-size:13px!important;line-height:15px!important;text-align:center;border-top:1px solid #dadada;margin:0 30px”><a target=”_blank” href=”https://infogr.am/807a9f5d-1a41-4458-8435-303000423383″ style=”color:#989898!important;text-decoration:none!important;”>Mexico issues better/worse</a><br><a style=”color:#989898!important;text-decoration:none!important;” href=”http://charts.infogr.am/bar-chart?utm_source=embed_bottom&utm_medium=seo&utm_campaign=bar_chart” target=”_blank”>Create bar charts</a></div>
Title: U.S. troops in Mexico
Poll question: Should the U.S. send troops into Mexico to help fight drug cartels?
Type: Interactive – pie chart – toggle between countries
Highlights: Sentiment is fairly split between yes and no, but Mexico residents are slightly more heavily against
Embed: <script id=”infogram_0_ba029d1a-7976-4317-a76e-78bb710a693c” title=”Poll: Troops to Mexico” src=”//e.infogr.am/js/embed.js?U37″ type=”text/javascript”></script><div style=”padding:8px 0;font-family:Arial!important;font-size:13px!important;line-height:15px!important;text-align:center;border-top:1px solid #dadada;margin:0 30px”><a target=”_blank” href=”https://infogr.am/ba029d1a-7976-4317-a76e-78bb710a693c” style=”color:#989898!important;text-decoration:none!important;”>Poll: Troops to Mexico</a><br><a style=”color:#989898!important;text-decoration:none!important;” href=”http://charts.infogr.am/pie-chart?utm_source=embed_bottom&utm_medium=seo&utm_campaign=pie_chart” target=”_blank”>Create pie charts</a></div>
Title: Government understanding of region needs
Poll question: Which of the following best describes how well the federal government on your side of the border understands the needs of the border region?
Type: Interactive – bar graph – toggle between countries
Highlights: U.S. residents are fairly evenly split, while 61 percent of Mexico residents say “not that well” or “not well at all”
Embed code: <script id=”infogram_0_da75b626-6e62-4567-a9a7-f2fe36124032″ title=”Border Residents on: Issues with Government” src=”//e.infogr.am/js/embed.js?tU9″ type=”text/javascript”></script><div style=”padding:8px 0;font-family:Arial!important;font-size:13px!important;line-height:15px!important;text-align:center;border-top:1px solid #dadada;margin:0 30px”><a target=”_blank” href=”https://infogr.am/da75b626-6e62-4567-a9a7-f2fe36124032″ style=”color:#989898!important;text-decoration:none!important;”>Border Residents on: Issues with Government</a><br><a style=”color:#989898!important;text-decoration:none!important;” href=”http://charts.infogr.am/bar-chart?utm_source=embed_bottom&utm_medium=seo&utm_campaign=bar_chart” target=”_blank”>Create bar charts</a></div>