- Slug: BC-CNS-Racial Gap,590
- Sidebar: States with biggest, smallest gaps
- Photo available (thumbnail, caption below)
By KRISTEN HWANG
Cronkite News
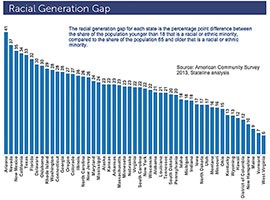
WASHINGTON – Arizona had the largest “racial generation gap” in 2013, a divide that has the potential to heighten political tensions in areas ranging from immigration policy to education funding, experts said.
The gap is the difference between the percentage of minorities who are 65 or older and those who are under age 18, according to an analysis of Census data by Stateline, a initiative of the Pew Charitable Trusts. It put the gap at 41 in Arizona, where minorities made up 18 percent of those 65 and older and 59 percent under age 18.
Nevada had the second-largest gap, of 37, while West Virginia had the narrowest gap, at 6.
“The demographic change is the single most important phenomenon going on (in Arizona), and it’s not something that can be legislated away,” said William Hart, a senior policy analyst with the Morrison Institute.
The demographic shift is most obvious in state schools, where minorities made up about 59 percent of the student body in the 2013-2014 academic year, according to data from the Arizona Department of Education. Hispanic students accounted for 44 percent of the student body that year.
Schools are also where the impact of the generation gap can be seen most clearly, experts said.
Arizona spent the least per student of any state in the 2012-2013 school years, according to the National Education Association’s 2014 Rankings & Estimates report. It said Arizona spent $6,949 per student in kindergarten through 12th grade that year, compared to a U.S. average of $10,938.
Census Bureau numbers for fiscal 2012 were similar, with Arizona ranking 49th in per pupil public education spending among all states and the District of Columbia.
While they may disagree on the link between spending and academic achievement, most education experts agree that school policy needs to take Arizona’s changing demographics into account.
“What you have is an older generation that is mainly white, and then you have a younger generation that is perhaps more diverse than any generation we’ve seen,” said Jonathan Butcher, education director at the Goldwater Institute. “That generation gap is something policy makers in the 21st century need to be aware of and understand because it’s going to determine the shape of policy.”
The young, Latino population of Arizona also faces an education achievement gap, something that experts say leaders need to address.
“(It) has tremendous implications for the attitudes of our leaders toward public education and the degree to which they value it,” Hart said. “If increasingly the ranks of students in Arizona’s public schools are individuals who do not look like the legislators and the other leaders in the state, there’s a real danger that they’ll be increasingly neglected.”
Demographers expect the racial generation gap to increase across the U.S. as minority and immigrant populations move from the coastal and border states to the inner states.
“It will first occur in schools. That’s where people notice it,” said William Frey, a Brookings Institution demographer studying race, migration and aging.
Joe Feagin, a sociologist from Texas A&M University who studies racial and ethnic relations, said older people have always had different priorities. They are more interested in retirement than education, while the inverse is true of younger generations. But adding race into the mix complicates things, he said.
“Right now we have this deep racial divide between an aging white population and a younger and rapidly growing population of color,” said Feagin – a 76-year-old who identifies as Irish American. “It creates great tensions – deep, deep racialized tensions in society.”
^__=
Web links:
_ Pew Article: http://www.pewtrusts.org/en/research-and-analysis/blogs/stateline/2015/1/16/racial-generation-gap-looms-large-for-states?utm_campaign=2015-01-16%20Stateline%20Daily.html&utm_medium=email&utm_source=Eloqua
_ NEA school spending estimates: http://www.nea.org/assets/docs/NEA-Rankings-and-Estimates-2013-2014.pdf
_ Census spending estimates: http://www2.census.gov/govs/school/12f33pub.pdf
^__=
SIDEBAR:
How the states stack up
The “racial generation gap” is the difference in minority populations under 18 and those 65 and over in every state and the District of Columbia. The biggest and smallest gaps (rounded), and the percentages of younger and older minority residents in each:
1. Arizona: 59 percent under 18; 18.1 percent 65 or older = gap of 41
2. Nevada: 62.1-25.5 = 37
3. New Mexico: 74.6-39.9 = 35
4. California: 73.4-39.6 = 34
5. Texas: 67.1-33.9 = 33
47. District of Columbia: 79.1-67.6 = 12
48. New Hampshire: 13.3-3.3 = 10
49. Maine: 10.7-2.2 = 9
50. Vermont: 9.6-2.5 = 7
51. West Virginia: 10.3-4.1 = 6
^__=
A Stateline analysis of Census data shows Arizona has the biggest “racial generation gap” – the difference between minority residents in older and younger groups. Experts say the gap can affect a number of policy areas. (Graphic by Stateline/The Pew Charitable Trusts)
